The term “moneyball” is often associated with the Oakland Athletics baseball franchise, which in 2002 assembled a competitive team through rigorous statistical analysis. But how does this concept translate to other industries, specifically the apparel industry?
“Moneyball” screen printing is a method used to improve productivity and profitability through data collection. The following outlines an example in which we implemented the method presented to improve a factory without further capital investment.
Factory A is a Central American factory, an 11-press automatic shop. They had four oval 12-color/32-station automatic presses. They had seven carousel 18-color automatic presses. Initially, the factory had severe workflow issues and low performance. It had a large labor force, unskilled with reading and writing and lacking computer skills. We held trainings to establish proper data collection methods and to place personnel in key roles.
Factory A maintained less than 25 percent below minimum orders of 288 pieces per single setup. Factory A created retail goods with a six-month sample to production turn. They maintained at least 25 percent special effects volume on their largest-volume customer.
Data Points
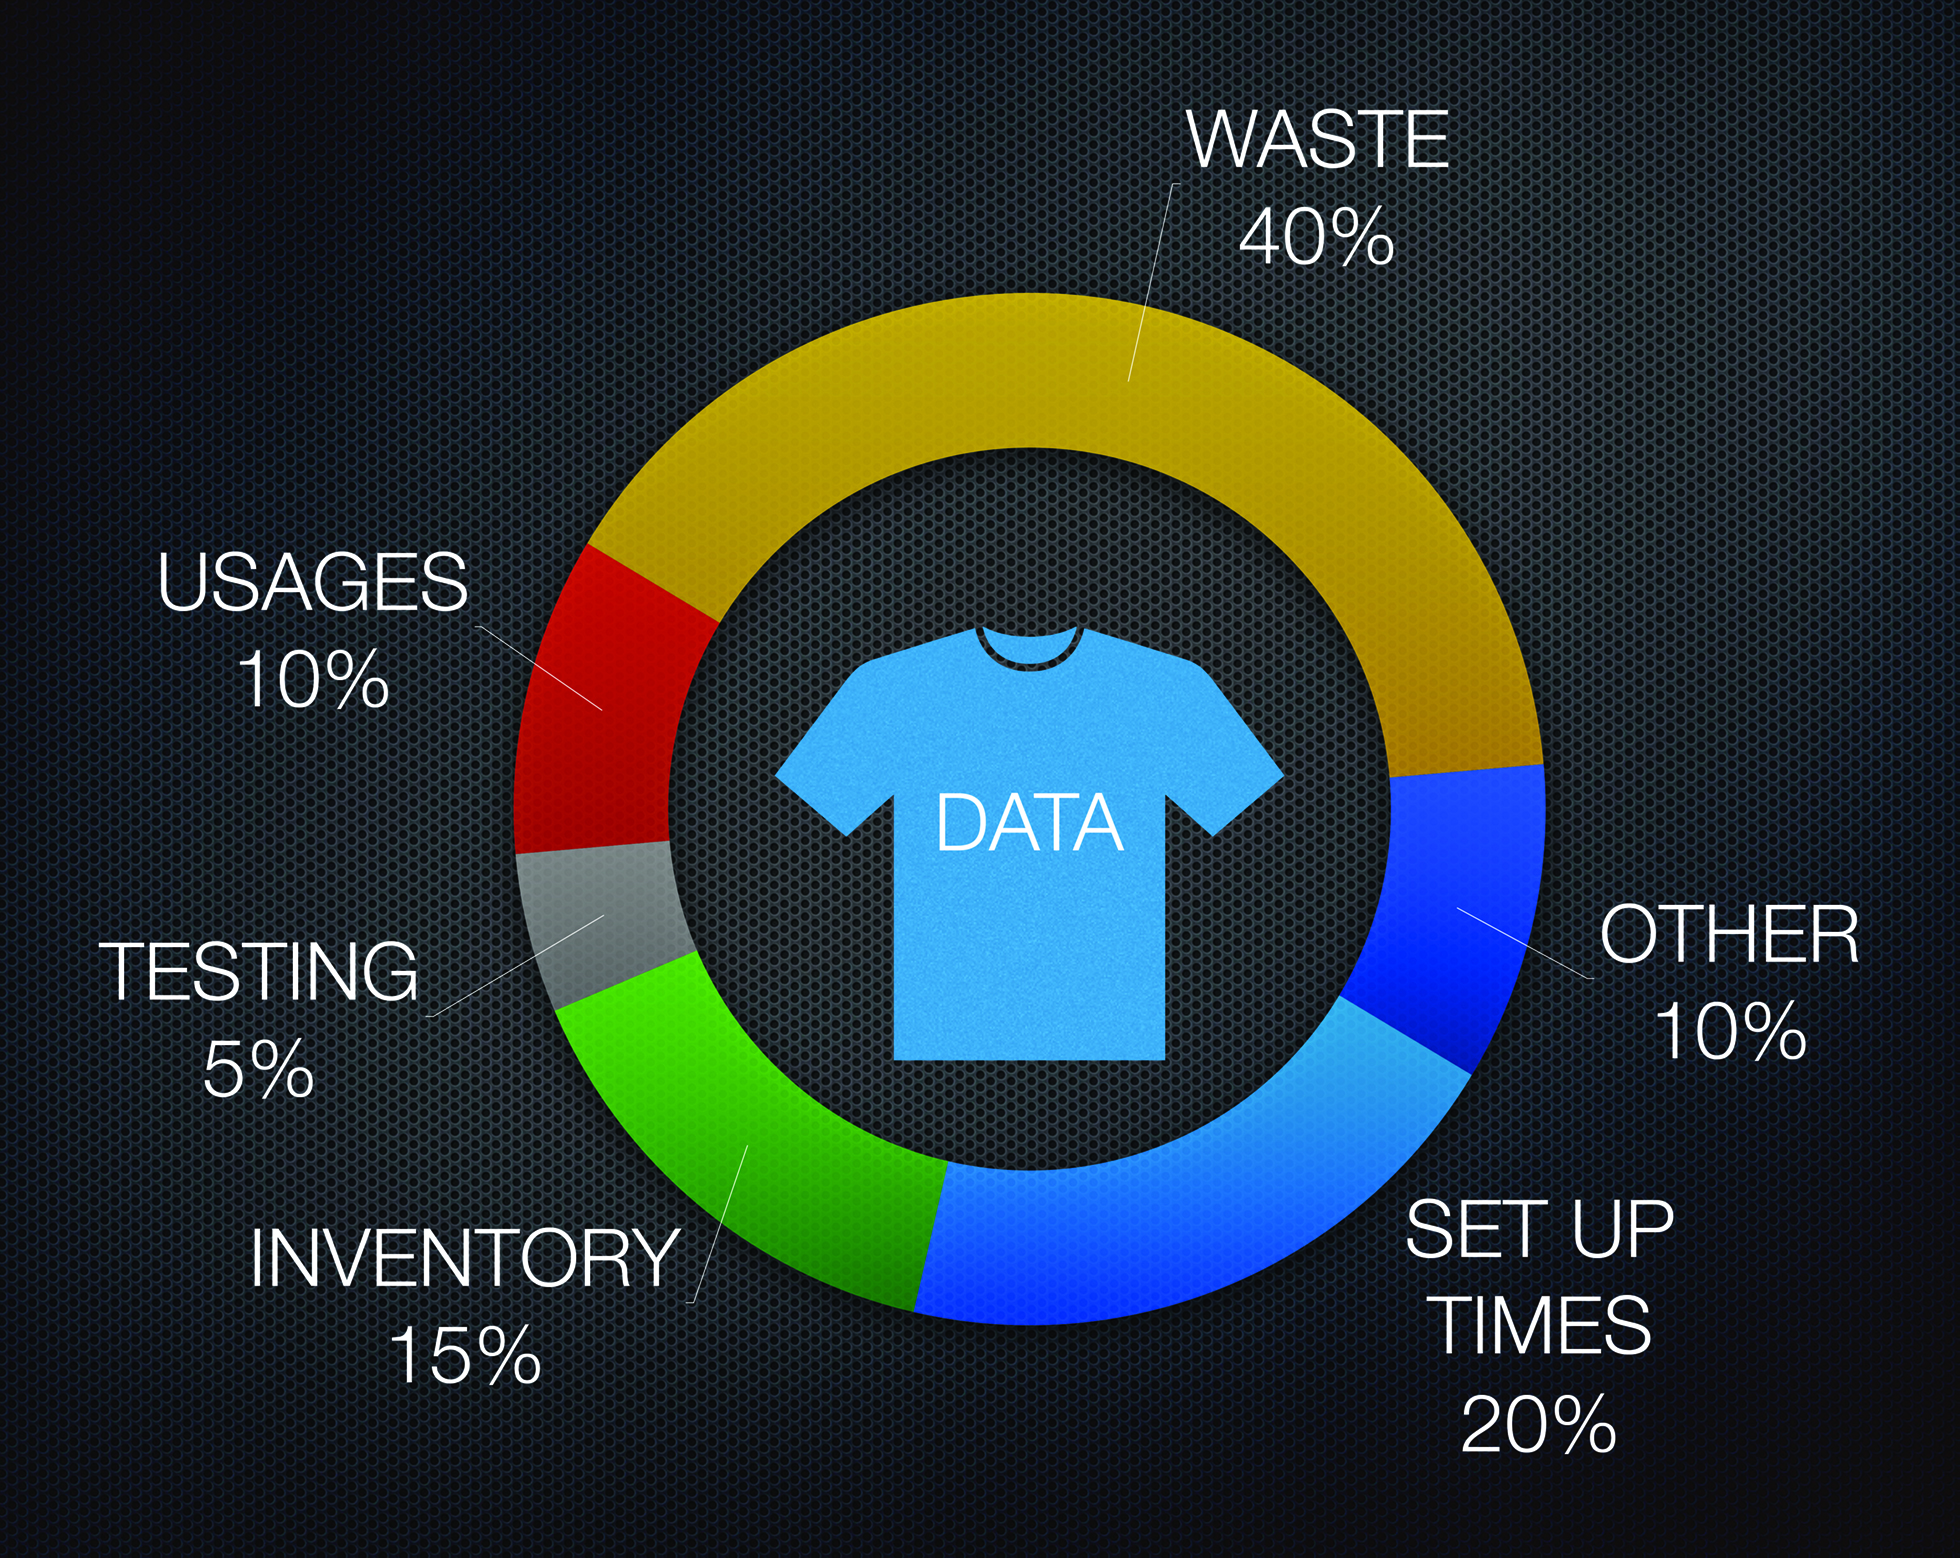
There are six unique data points that contributed to Factory A’s success. The data points had a percentage of weight in the overall success of the outcome. These included waste at 40 percent—the largest contributing factor to the success of the model. Usage, at 10 percent, included consumables used daily by each department. At 5 percent, testing included durability results and non-retail or “B” grade product. Inventory at 15 percent included inventory for samples and pre-printed samples for reorders. Finally, setup times were at 20 percent, and “other” factored in at 10 percent.
“Other” accounted for several important key elements. For example, the print information sheet included screen count, flash count, equipment requirement, cost and price, image size, and special effects. This data was compiled for accurate scheduling at any stage of the process to avoid bottlenecks. “Other” also included shipping costs on consumables and machine maintenance.
Factory A collected data on the setups including “screens per day average” and “flashes per day average,” for water base and plastisol. “Time per setup” was also collected as this was relevant for us to create daily maps for the operator workflow.
For example, if the average number of screens was eight, the average number of flashes was four and the average time was 40 minutes. We could provide the operator a map for the day based on the 40 minutes along with staging areas for flashes, reducing the need to chase down peripheral equipment.
Collection Methods
Setup in Factory A was the time it took from touching the first screen (the first action in a planned map), to handing the quality control a finished printed garment. If quality control rejected the garment for a printing error, the setup time continued. If they rejected the garment because of an art or screen error, the style would start over and add to “per article rate” as a negative. If they rejected the style for aesthetic reasons, it moved to the quality control report.
Next to be observed was “per screen setup.” This is important because if a factory is running a long average (e.g., 15 minutes per screen), you can target a reduction to 14 minutes/screen, which is easy to achieve and reward. When employees are tracking their success, it is important to incentivize them. It is easier to use per screen setup as the basis for creating goals, rather than setting the goal of decreasing a job time from 50 to 40 minutes. They may not see this as achievable because the next job could only take 30 minutes due to a reduced screen count.
We collected “special effect screen average” next. This is important because it identifies the anomalies and helps you see where there may be some inefficiencies. Typically, effects take longer to set up than flat inks. The data collection might show you that one operator is much faster at setup and approvals on high-density printing, creating an opportunity for cross-training with another who is losing time. It also provides reasons for “out of range” setups and helps stabilize the data.
Lastly, “setup materials”—how many pieces were used to set up the job—was ultimately tallied against waste data.
Factory A Analysis
When Factory A was initially analyzed, we established the setup time as 48 minutes per screen. Over a two-year period of data and analytics, they established a time of nine minutes per screen. We reduced 158 setup pieces to a standard 32 pieces per job—or one round on the oval machine.
It is also important to note Factory A’s results were supported using incentives and positive reinforcement. If the team achieved goals, they would win meal tickets to the cafeteria. We only gave incentives to teams and never to individuals unless there was a contest. Contests only took place during training scenarios. For example, to win a meal ticket in samples, the team had to produce three setups per day per press operating in samples. For every day they completed the target, they would win a meal ticket for the team. They could only win if they completed the entire sample season on time with aesthetic efficiency. The team never lost in the duration of the program, which is why employees considering such tactics should be prepared to follow through and be proud to provide rewards.
The goals were always small steps that were easily achievable. If teams showed any challenges achieving their goal, we created training based on the data collected. At one point, for example, there was an issue with quality control rejecting the aesthetic during samples. It was happening frequently and causing delays. We held a contest in which the tested printers received rewards individually on achieving several aesthetic and hand-feel challenges, which improved overall efficiency.
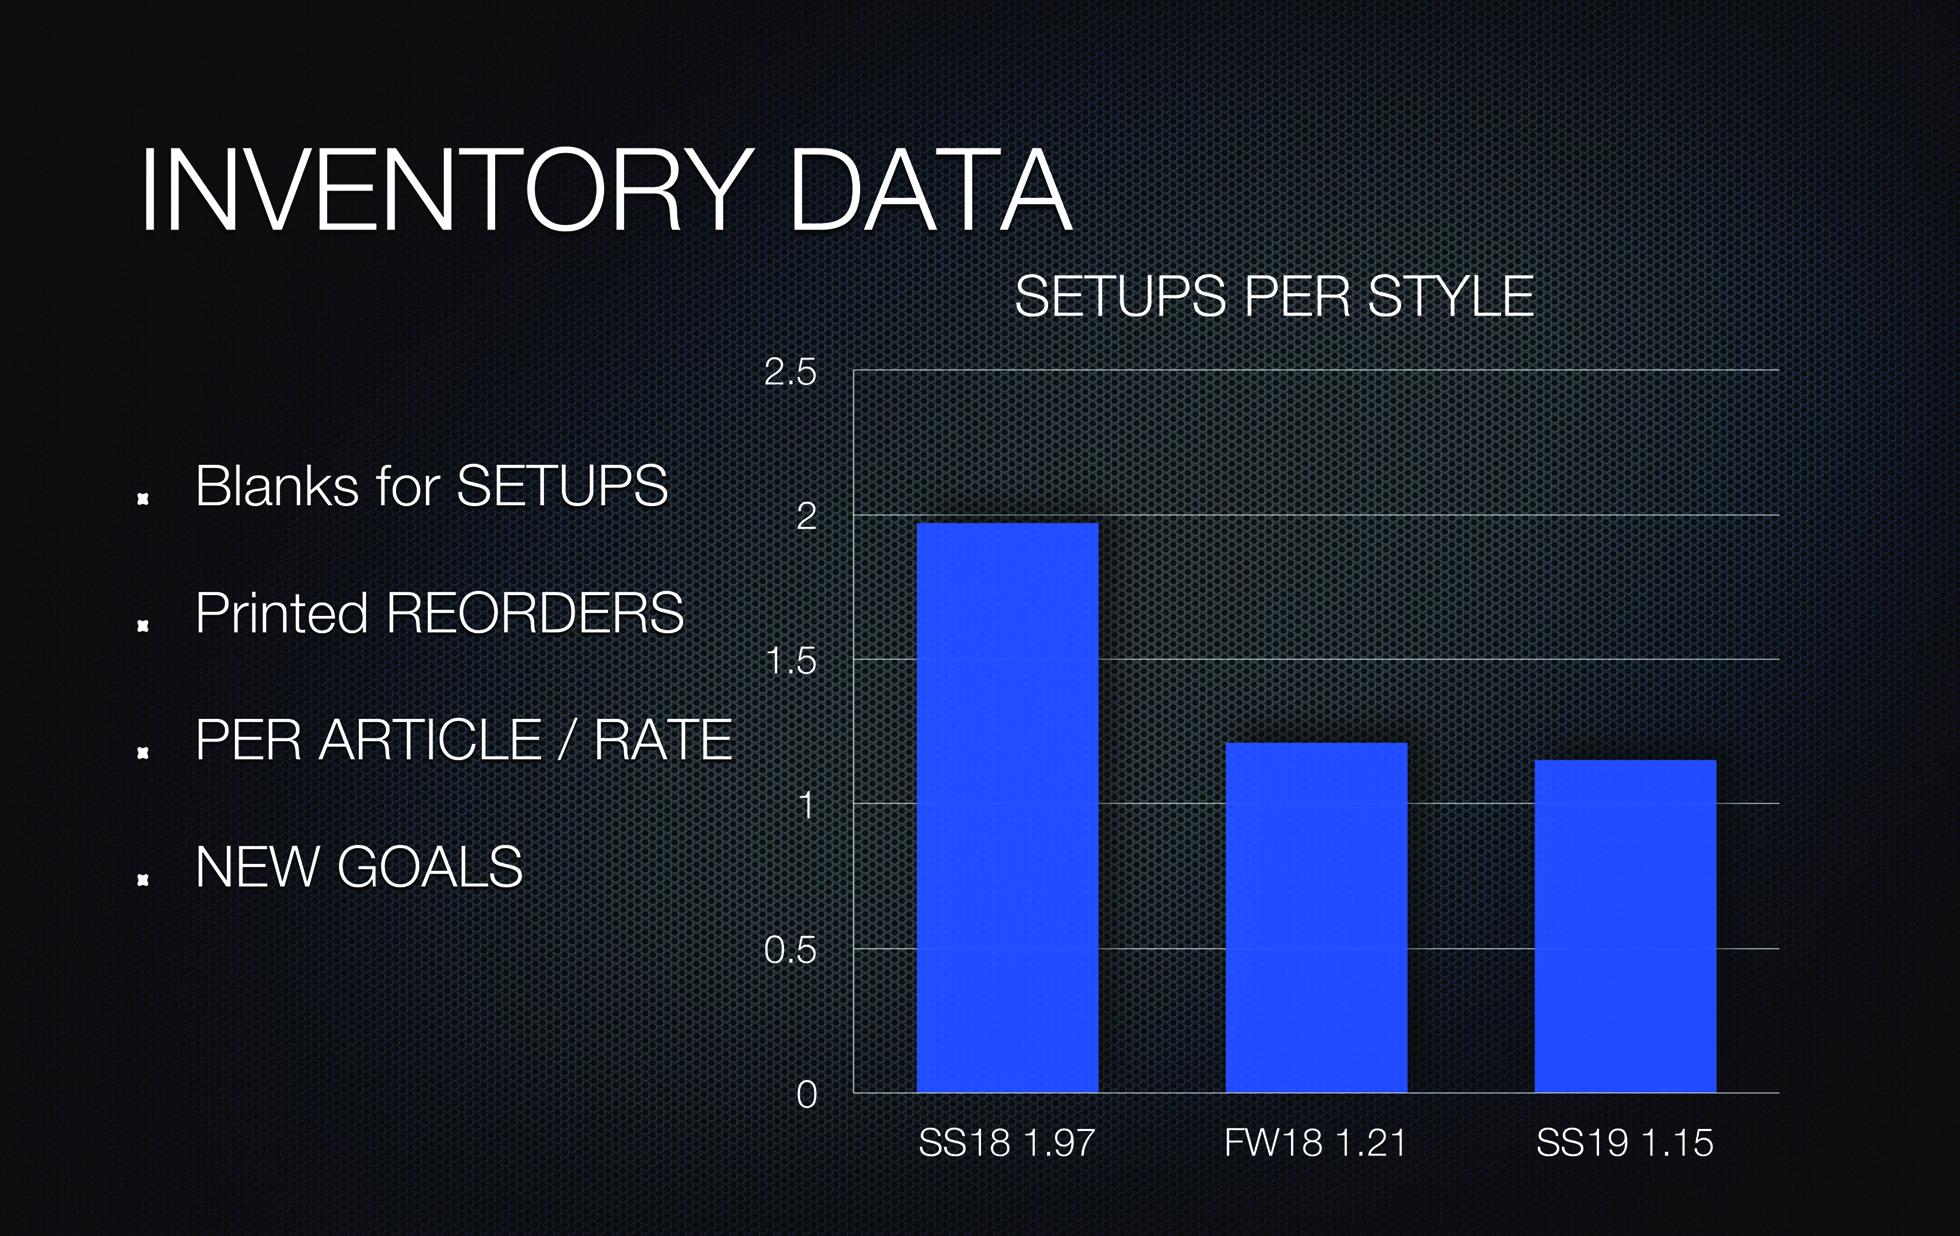
Inventory data included “blanks for setups,” “printed reorders,” and “per article rate.” “Per article rate” was essentially an efficiency rating showing how many times a style was set up before we produced it. After initial training, the factory performed at a 2.0 per article rate; after efficiencies and corrections, the factory achieved 1.15 per article rate.
Using a linear regression model, we anticipated sample orders and reduced the per article rate. We used pre-printed inventory to minimize multiple setups and reduce cost. We added any excess inventory into production orders at the end of the season.
The factory created a “B” grade report with 25 data points related to product failure during quality control. We gave each line item a percentage of failure to contribute to the overall reject rate. Development could then address the core issues and measure success through durability and B grade data. For example, lint was a 20 percent failure rate, and when development added a lint removal screen, the lint failure dropped to less than 6 percent, which improved overall durability.
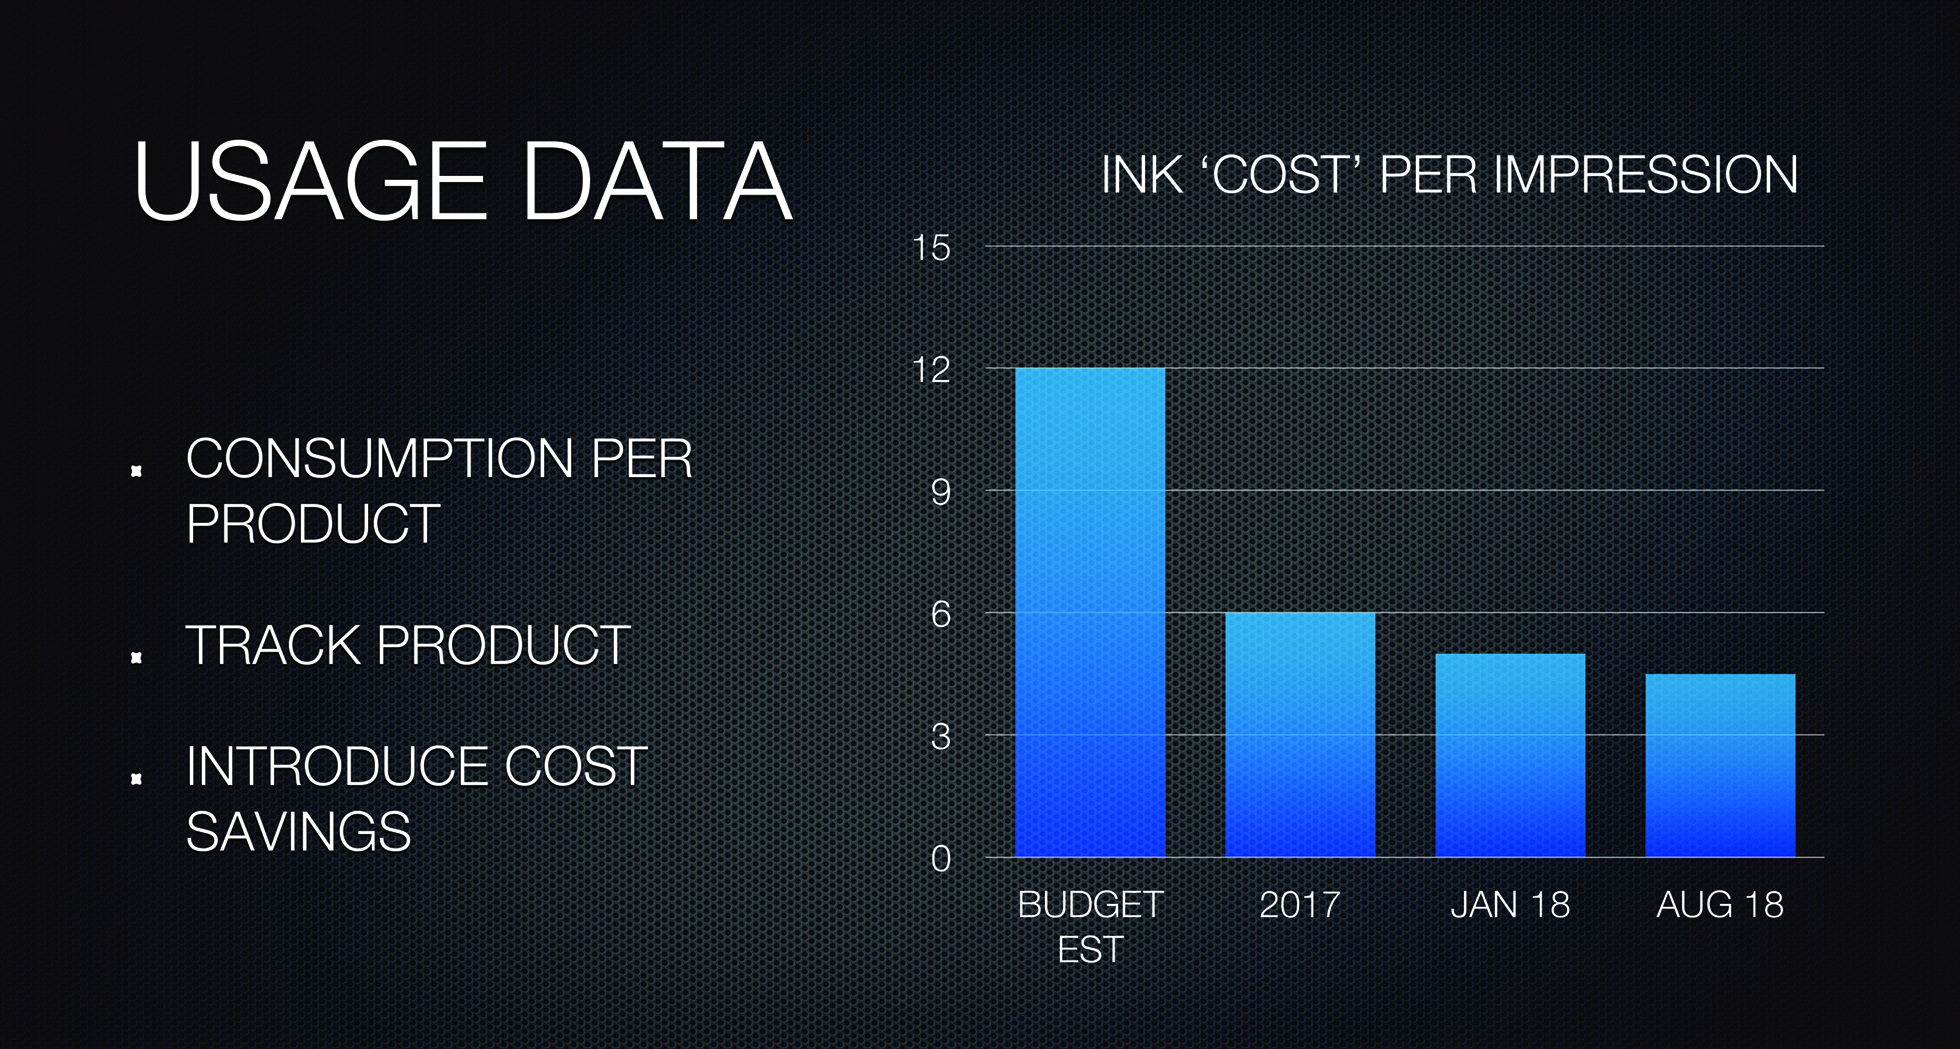
The daily ink report showed consumptions of all products in grams, which helped with targeted training when we saw misuse. The average also helped in consumable order accuracy.
The daily screen report showed all screens made, humidity levels, broken screens, and reclaim waste in grams. We also measured HD screen emulsion in grams by crosschecking emulsion usage, which reassured measurements taken by the micrometer were accurate.
Lastly, waste data showed the largest margin increase to the factory’s profitability. It provided the most opportunity for behavior improvements and reduced waste.
To begin waste monitoring, they used an opportunity to print 1.5 million water base units with a left sleeve imprint. The process required three screens of white ink, labeled as A, B, and C. We standardized flashes, squeegees, screens, and flood bars. We took 30-kg drums and placed them on the floor and labeled them, A, B and C, while labeling the production ink A, B, and C. We removed all the trashcans. We instructed the team that any “garbage” ink would go into the corresponding 30 kg receptacle. The ink room took the 30 kg container and removed anything truly “dead,” refreshed the rest, and returned it to the floor the next day. At the end of 1.5 million units, we had one 30-kg drum full of “dead” ink. This ink was refreshed using a strong additive for the particular product, and we used the ink for training and contests. Essentially, at the end of a 1.5 million unit run with a consumable product that has potential to create waste, we had zero waste. We then took the experiment shop-wide.
Waste measured in grams was reported by inks and screen reclaim daily. Each week the target percentage reduced through mainly on-press training and handling procedures. After we finished initial ink training, setup shirts were also reduced. We set a reasonable amount of setup shirts and included it as part of the operating cost. Anything in excess was “out of range” and targeted and reduced. Initially, the factory was measuring 27 percent consumable waste. At the end of the program, it was less than 2 percent.
Factory A’s Final Results
Factory A had a significant margin increase—more than 35 percent—as the factory was not profitable when the program started and was well within target at its completion. The factory saw an increase in business from 4 million to 12 million units with the retail brand they had already established and additional retail brand growth. Finally, the factory was the first factory outside of Asia awarded a Vendor Speed Award.
Want more screen printing knowledge and insights straight from the experts? Click here to register for the PRINTING United Digital Experience – Apparel/Screen Decorating Day (Tuesday, Oct. 27). Or, click here for more information on the PRINTING United Digital Experience, including Apparel – Direct-to-Garment/Direct-to-Substrate Day (Monday, Nov. 9). The PRINTING United Digital Experience runs from Oct. 26 through Nov. 12 and is free to attend.
This article appears in the PRINTING United Digital Experience Guide and was republished here with permission.


