Our most recent look at the pandemic’s impact on the promotional products industry showed that sales are continuing to decline in the industry overall, but for the first time since the spring, the decline is starting to level out. That was an encouraging sign—but even more encouraging might be the data surrounding changes in product demand. Several product categories are now performing quite well compared to their pandemic lows, and some of them may be surprising.
The third installment of our COVID-19 Promotional Products Industry Recovery Research, produced by NAPCO Research in collaboration with Promo Marketing, identified the following product trends:
• Health care products remained No. 1 in terms of overall demand, but the category is cooling off. In June-July 2020, 67.5% of respondents said they were seeing increasing demand for health care products. That has since dropped to 55.9%—still increasing, but slowing down. Still, the category overall remains strong, with 82.9% of respondents saying demand is either increasing or staying the same.
• The apparel category also remained strong, significantly building on the upward trend in demand we saw in our second report. During the June-July period, 18.6% of promo companies surveyed reported increasing sales, which was an improvement over just 10% for April-May. For our most recent period, though, 42% of companies said demand for apparel was increasing, while 29.8% said it was staying steady. That’s a combined 71.8% of respondents reporting increasing or stabilized demand for apparel.
• Now for a surprising one. In the previous installment of our this report, just 10.7% of respondents said demand for drinkware was increasing, while 56% said it was decreasing. In our most recent report, however, 29.9% of respondents said drinkware demand was increasing, while 41% said it was staying the same. Just 29.1% reported decreasing demand.
• A similar bounceback also occurred in the technology category. In June-July, fewer than 10% of respondents said demand for tech items was increasing. That number has since risen to 23.8%. Just 33.3% of respondents now say demand for the tech category is decreasing, compared to 55.8% in the previous report period.
All told, every product category included in our survey saw increasing demand over the prior reporting period. Some of these increases were negligible—trade show products, for example, went from 3.7% increasing to 4.4% increasing. There simply aren’t many, if any, live events happening right now. But the overall product demand data points to a continuing bounce-back for more traditional promotional products.
***
Elsewhere in our research, 79% of surveyed companies said they were starting to plan out what their next steps will be once the COVID-19 threat goes away (or at least subsides significantly).
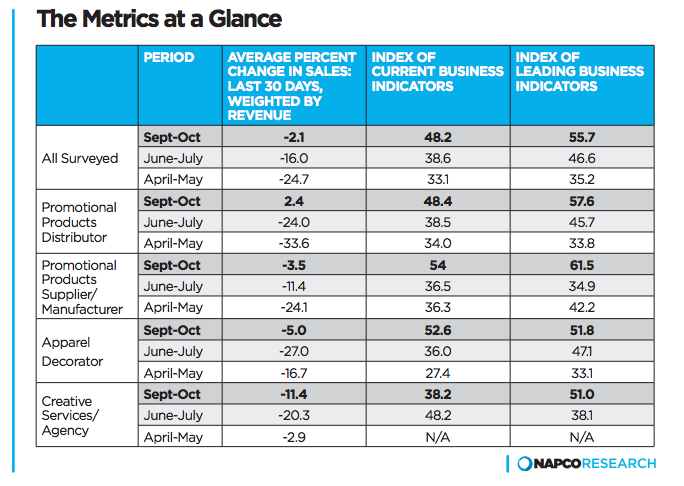
We crunched the numbers to create an index of current business indicators (such as sales, pre-tax profitability, employment and prices), and got a score of 48.2. For reference, a score below 50 means that more companies are reporting falling activity than rising activity. For even more reference, our previous report showed an index of 38.6. The one before that, 33.1.
“Even more optimism can be taken from the most recent index of leading business indicators (quote activity, new orders, and confidence), which closed at 55.7 for the current period, compared to 46.6 for the second report and 35.2 for the first. A reading above 50.0 means more companies report these forward-looking measures of activity are rising than report they are falling. This is the first time that there has been an index reading above 50.0, which indicates that the industry is likely to see growth soon. Promotional product suppliers and apparel decorators are now both seeing current and leading indexes read above 50.0, while distributors reflect the industry at large with a current index value just below 50 (48.4) and al reading index comfortably above 50 57.6).”
Looking just at the percent in sales change over the last 30 days, the optimism is justified.
- Between September to October, everyone we surveyed saw a -2.1% change in sales. In June-July, that figure was -16%. In April-May, it was -24.7%.
- Promotional products distributors, specifically, saw an overall 2.4% average increase in sales activity, compared to -24% for June-July and -33.6 for April-May. That’s the biggest jump we measured, with apparel decorators seeing a jump from -27% in June-July to -5% for September-October.
For more insights and data on how promo businesses have been impacted by the pandemic, download the full COVID-19 Promotional Products Industry Recovery Research: Volume 1, Number 3 study here or click the image below.
About NAPCO Research
NAPCO Research develops research and economic models that solve customer business problems. Market research is valuable for making strategic business decisions, solving challenges, and pursuing opportunities, and the NAPCO Media research team surveys, analyzes, and monitors critical trends related to marketing, printing, packaging, nonprofit organizations, promotional products, and retailing. To learn more about how the team can leverage its research and industry subject matter experts to support your organization’s needs, contact Nathan Safran, vice president of research for NAPCO Media, at [email protected].


